December 2016 Statewide Economic Indicators
The December 2016 State of Oregon Economic Indexes of was released today. Full report is available here. We thank KeyBank for their generous support of this project.
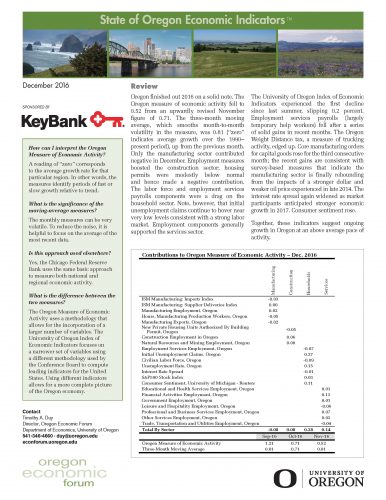
Oregon finished out 2016 on a solid note. Highlights of this month’s report include:
- The Oregon measure of economic activity fell to 0.52 from an upwardly revised November figure of 0.71. The three-month moving average, which smooths month-to-month volatility in the measure, was 0.81 (“zero” indicates average growth over the 1990-present period), up from the previous month.
- Only the manufacturing sector contributed negative in December. Employment measures boosted the construction sector; housing permits were modestly below normal and hence made a negative contribution.
- The labor force and employment services payrolls components were a drag on the household sector. Note, however, that initial unemployment claims continue to hover near very low levels consistent with a strong labor market. Employment components generally supported the services sector.
- The University of Oregon Index of Economic Indicators experienced the first declined since last summer, slipping 0.2 percent. Employment services payrolls (largely temporary help workers) fell after a series of solid gains in recent months.
- Core manufacturing orders for capital goods rose for the third consecutive month; the recent gains are consistent with survey-based measures that indicate the manufacturing sector is finally rebounding from the impacts of a stronger dollar and weaker oil price experienced in late 2014.
Together, these indicators suggest ongoing growth in Oregon at an above average pace of activity.
© 1987-2024 SOREDI 1311 East Barnett Road, Suite 301, Medford 97504 • Phone: (541) 773-8946 • Fax: (541) 779-0953