
Miscellaneous

Oregon’s Solid Job Growth and Low Unemployment Rate Continue in March
Oregon’s unemployment rate was 4.1 percent in February and March. For 15 consecutive months, the rate has been close to 4.1 percent, its lowest level since comparable records began in 1976. The U.S. unemployment rate was also 4.1 percent in both February and March. The economy continues to expand as reflected by record highs in Oregon’s civilian labor force (2,132,000 individuals) and total
It Takes Two (or More): Oregon’s Multiple Jobholders in 2017
In 2017, 116,000 Oregonians held more than one job in addition to their primary job and were considered to be multiple jobholders. The multiple-jobholding rate – the proportion of multiple jobholders among all employed workers – was 5.7 percent, which was above the U.S. rate of 4.9 percent. Oregon’s multiple-jobholding rate reached a recent high of 6.7 percent in 2012, and was as low as 5.2

February 2018 Oregon Statewide Economic Indicators
This is the University of Oregon State of Oregon Economic Indicators for February 2018. The release date is April 10, 2018. Special thanks to our sponsor, KeyBank Willamette Valley Oregon Economic Forum Join us Thursday May 10, 2018 in Salem… Continue Reading →

Oregon’s Forestry and Logging Industry
Oregon is one of the world’s great tree-growing areas. The state’s soils and climate provide ideal conditions to grow such commercially viable species as Douglas fir and ponderosa pine. Forests cover more than 30 million of Oregon’s 62 million acres – almost half of the state’s landmass.
The Oregon Department of Forestry estimates logging harvests totaled 3.9 billion board feet in 2016. While
Oregon Businesses Report 49,500 Winter Job Vacancies
The Employment Department’s latest job vacancy survey shows Oregon’s private employers reported 49,500 job vacancies in winter 2018. They reported a similar level of job vacancies (50,600) the previous winter.
While the total number of vacancies remained stable over the year, there was a notable increase in the number of job vacancies with “other” education requirements. These job openings
January 2018 Oregon Regional Economic Indicators
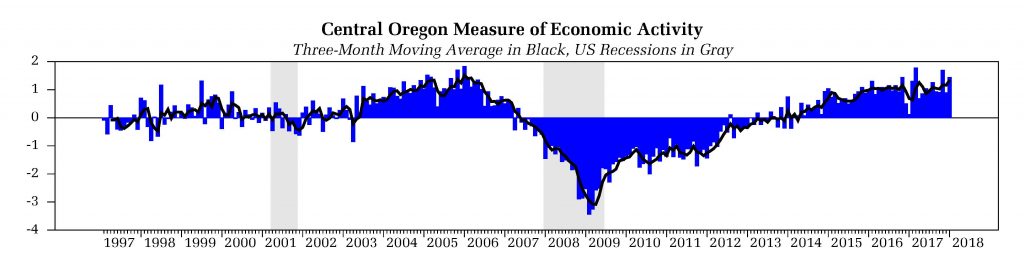
Good morning. This is the University of Oregon Regional Economic Indexes for January 2018. The release date is today, April 2, 2018. We thank KeyBank for their generous support of this project. Oregon Regional Economic Indicators: Regional economies continued to show… Continue Reading →
Oregon’s Job Growth Fifth Fastest Among the States
Oregon had the fifth fastest job growth among the states from January 2017 to January 2018. Adding 50,600 jobs for a growth rate of 2.7 percent, Oregon’s solid job growth was slower than first ranked Utah (+3.1%) and neighboring Idaho, Nevada, and Washington, which tied for second with growth rates of 2.8 percent. California ranked seventh with a growth rate of 2.4 percent.
Looking at job growth
February 2018 Employment and Unemployment in Oregon’s Counties
Wheeler County had Oregon’s lowest seasonally adjusted unemployment rate at 2.8 percent in February 2018. Other counties with some of the lowest unemployment rates in February include Gilliam (2.9%) and Benton (3.1%). Grant County registered the highest unemployment rate for the month at 7.0 percent.
Thirteen of Oregon’s counties had unemployment rates at or below the statewide and national
Breaking the Mold: Nontraditional Jobs for Women
The Department of Labor Women’s Bureau categorizes occupations into traditional and nontraditional based on the percentage of women employed in those occupations. Traditional or female-dominated occupations are those in which women make up 75 percent or more of the total employed in that occupation. Nontraditional or male-dominated occupations are those in which women represent 25 percent or less