
Miscellaneous

Oregon’s Economy Remains Strong—Adds 2,700 Jobs in February
Oregon’s unemployment rate was 4.1 percent in January and February. For 14 consecutive months, Oregon’s unemployment rate has been close to 4.1 percent, its lowest level since comparable records began in 1976. The U.S. unemployment rate was also 4.1 percent in both January and February.
In February, Oregon’s nonfarm payroll employment grew by 2,700 jobs, following a revised gain of 4,900 jobs in
Get to Work! How Oregonians Commute to Work
Most Oregonians work in the same county that they live in. However, 20 percent of Oregonians work outside the county they live in. And in a few Oregon counties, about half the workers leave their home to work. Moving half the workforce out – and back into – a community every day puts an unusually large amount of pressure on local transportation systems.
Clackamas County has the largest
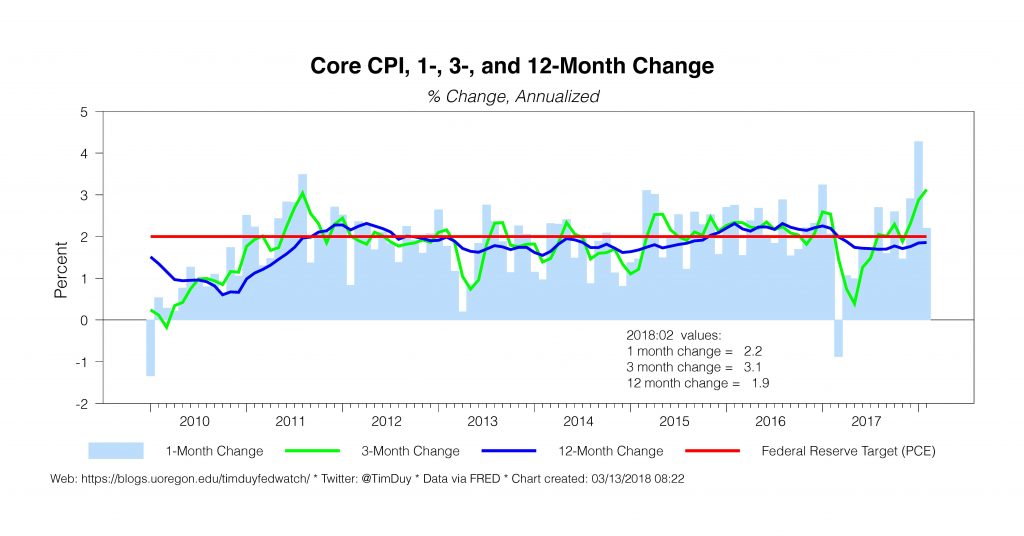
Inflation Still Soft
Consumer price inflation eased back from the January spike, silencing concerns that inflation would soon make a comeback. This will help keep the Fed focused on its gradual tightening path. If they want to shift gears, they will have to… Continue Reading →
January 2018 Employment and Unemployment in Oregon’s Counties
Benton County had Oregon’s lowest seasonally adjusted unemployment rate at 2.9 percent in January 2018. Other counties with some of the lowest unemployment rates in January include Wheeler (3.0%) and Hood River (3.2%).
Eastern and Southern Oregon had higher unemployment rates in January 2018, some of which were still at or close to their record low unemployment rates since 1990. Grant County
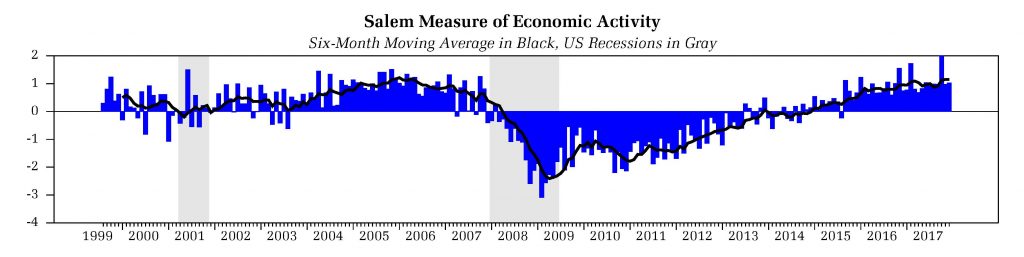
December 2017 Oregon Regional Economic Indicators
Good morning. Attached is the University of Oregon Regional Economic Indexes for December 2017. The release date is today, March 13, 2018. We thank KeyBank for their generous support of this project. Oregon Regional Economic Indicators: Full report available here…… Continue Reading →

January 2018 Oregon Statewide Economic Indicators
This is the University of Oregon State of Oregon Economic Indicators for January 2018. The release date is March 8, 2018. Special thanks to our sponsor, KeyBank Link to full report here. The Oregon Measure of Economic Activity declined modestly… Continue Reading →
Oregon Adds 5,000 Jobs in January
In January, Oregon’s nonfarm payroll employment grew by 5,000 jobs, following a revised gain of 9,800 jobs in December. Three major industries each added close to 1,000 jobs: private educational services (+1,100 jobs), construction (+1,000), and manufacturing (+800). These gains were partially offset by a loss of 700 jobs in leisure and hospitality. Health care and social assistance added 2,300
Worker Access to Paid Leave Benefits
In the United States, 72 percent of workers have access to paid sick leave through their employers. A slightly higher share has access to paid vacation (74%) and paid holidays (76%). This access varies between the public and private sectors. In private industry, about two-thirds of workers have access to paid sick leave and just over three-quarters of workers have access to paid vacation and paid
Earn While You Learn: Apprenticeship Training
Not interested in going to college? Do you like learning in a hands-on environment while earning money at the same time? An apprenticeship might be a great training opportunity for you.
But how do you decide which apprenticeship program to pursue? Some things to consider when you are contemplating career choices are whether there will likely be job openings available once you complete your
Oregon’s Social Assistance Industry
Social assistance is a unique industry group with jobs in private industry, both for profit and nonprofit establishments, as well as government. Each ownership category and type has carved out its own niche, offering invaluable services to Oregonians faced with a critical need.
The employment split between private industry and government hovered around 60/40 in 2016. Private industry’s 60